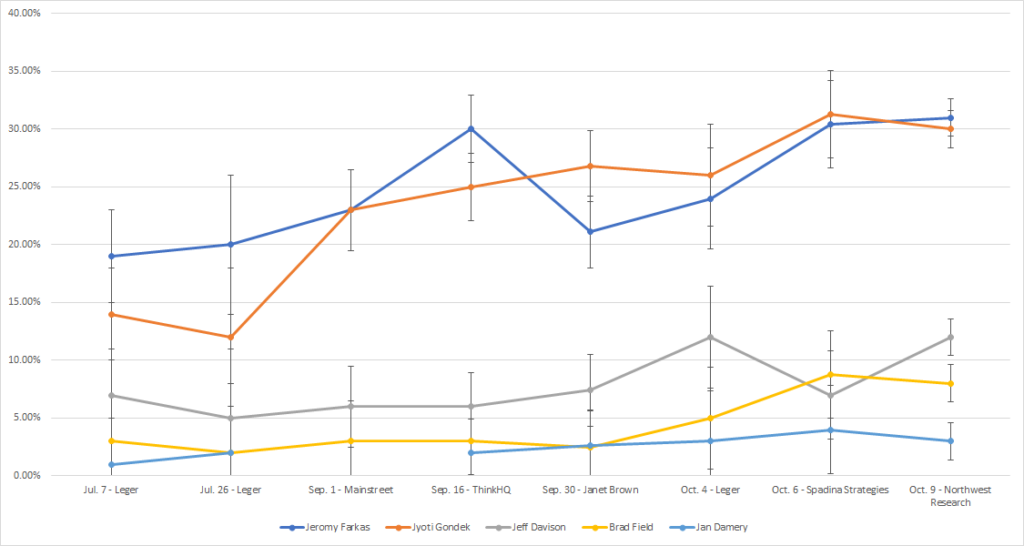
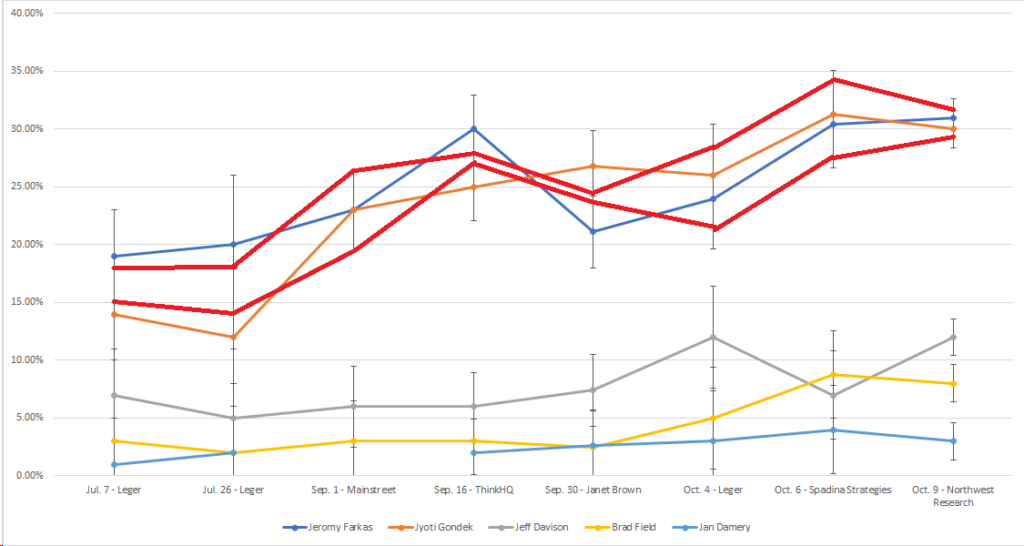
How are we to read the polls with the results? What can the amateur poll reader to look out for next time.
I’m going to look at two polls which built samples from the entire city, and weren’t content to treat the entire city as a single unit.
First we had ThinkHQ. They were in the field from September 13 to 16th. They used an online forum, Angus Reid. (full poll)
There are two things to tease out, and they only come with healthy assumptions. If you don’t agree, let me know!
- Samples which ensure wider representation take more effort and the panel might start fill up fast in some areas of the city, but not in others where it may take multiple days to fill the sample.
- Events can shake the electorate along the way, but instead of going back to measure again, they can be observed as just regional differences.
I think that is what may have happened here. And we can tease it out on the ThinkHQ page. More time in the field to fill the sample from the NE and Inner City? Well, that is more time after huge events to start shifting the trajectory of the election.

On September 15th we had the Alberta government move forward with vaccine passports, and this viral tweet from Jyoti Gondek.

The reach of this tweet would have been large, and primed the pump for the next main event. With active Twitter accounts in Canada belonging to ¼ of the adult population, I’d hazard that the Tweet, would have been served even to those unengaged in politics by the Twitter algorithm.
Then we have the second tweet, a week later.

If the first, a week earlier, hadn’t breached non-politicos’ feeds, this one surely would. On an issue people care about. On an issue that is at the height of the issue-attention cycle.
So onto the second poll, from Janet Brown Opinion Research. (full poll)
This poll was in the field from September 22 to 30th (9 days) and partly used an existing panel, and partly a panel recruited for this survey. (by way of comparison, their similarly sized provincial panel in 2019 was 6 days in the field)
There are some interesting bits here. The NE is pretty close to the ThinkHQ Mayoral result. Ok, so maybe confirmation of the time shift? Or is it regional? The NW seems to have disconnected from the SW for Farkas. I’ll take that as residual hangover from the Farkas’ SW Council Seat. But we still have a Gondek bump in the SW, just not as large.

When we get the more detailed results from Elections Calgary, we will see if the SW caught up with the NW, or if the shift to Gondek accelerated generally to get us to the end results.
We can use a bit of math to check on the results of the Janet Brown poll without undecideds (Don’t know/none of the above) – with much apologies for statistical crimes, and comparing them to the election’s actual result.

With a reported margin of error of 3.1%, and the effect of time, this looks pretty good to me. The polling companies which put more effort to ensure all areas of the city were right on the money.
The poll even likely helped with consolidation behind Jyoti Gondek – at least the Gondek campaign thought as much!
They spent between $7000 and $8000 to put the ad below on Calgarians’ screens 600-700 thousand times from October 6th to 12th.

So, next time around, what I will be looking for:
Polls which sample and weight by quadrants, or another measure. The ‘rings’ approach by ThinkHQ is useful too, and for provincial I’d add a third ‘ring’—the CMA but outside of the City limits, given the divergent results we’ve seen when pollsters have split city proper from their ex-urban and true suburbs.


